CHIPSCollaborative Heuristic for Iterative Planning and Story-pointing
Features / Analytics & forecasts

See how your team really estimates.

Reports from the votes, notes and delivery data CHIPS already keeps; forecasts of when the work will be done; and a review of the stories that ran over. Anonymous rounds are never attributed to anyone, and every table downloads as CSV.

EnterpriseThe demo's analytics: every edition
Analytics

Questions every retrospective asks, answered with data.

Estimators
Who estimates high, who estimates low?

Each first vote against the final estimate, with a tendency per person.

Estimators
Who is most often the highest or lowest?

Counted in rounds where at least three people disagreed.

Velocity
Who contributes what?

Planned and delivered points per sprint, and each owner's share.

Agreement
Where do we see it differently?

The spread of first votes per story, most divergent first, by technique.

Anchoring
Do we follow the first speaker, or the most senior?

How far final estimates move toward them, against everyone else.

Quality
Where do defects and carry-over come from?

Defects, rework and carry-over by owner and by whose estimate was chosen.

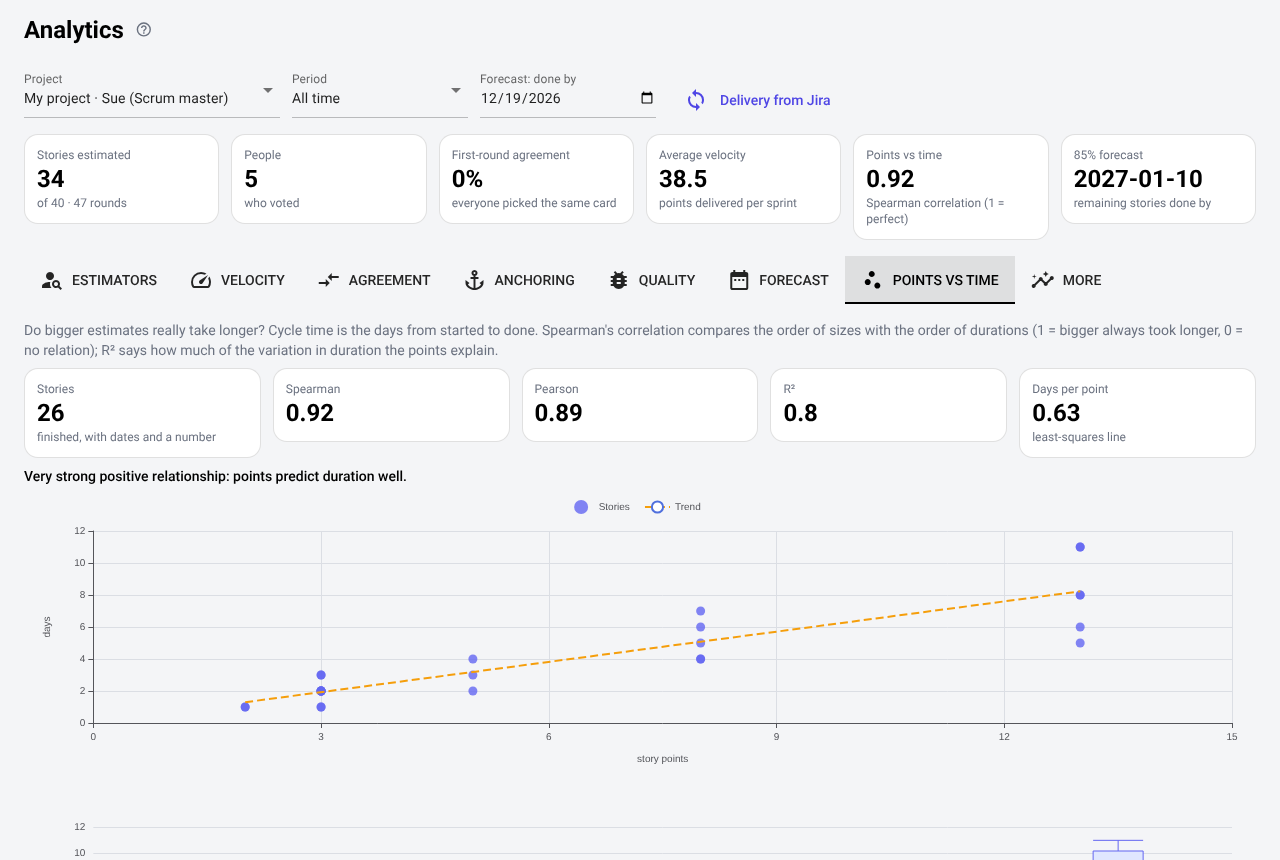
Points vs time
Do points predict how long work takes?

Spearman, Pearson and R² between story points and cycle time.

More
Are our points inflating?

Size drift by sprint, epics against their parts, and time spent estimating.
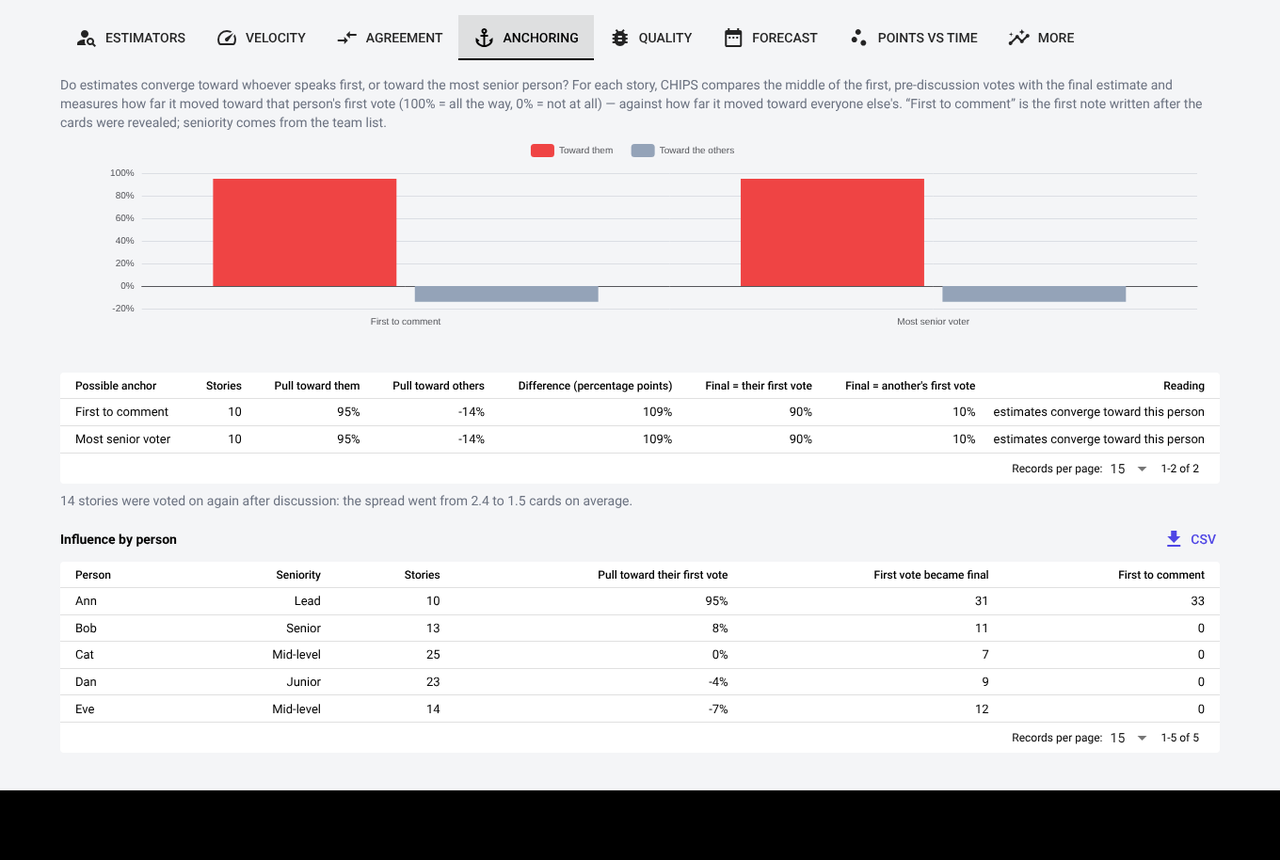
Anchoring report: estimates move 95% toward the first commenter and the most senior voter, against minus 14% toward the others
Anchoring: in the demo, final estimates follow one person.
Points against time: story points against days from start to done, with Spearman 0.92 and a trend line
Points vs time: in the demo, bigger estimates really do take longer (Spearman 0.92).
Forecasts and what-if

When will it be done — and what if things change?

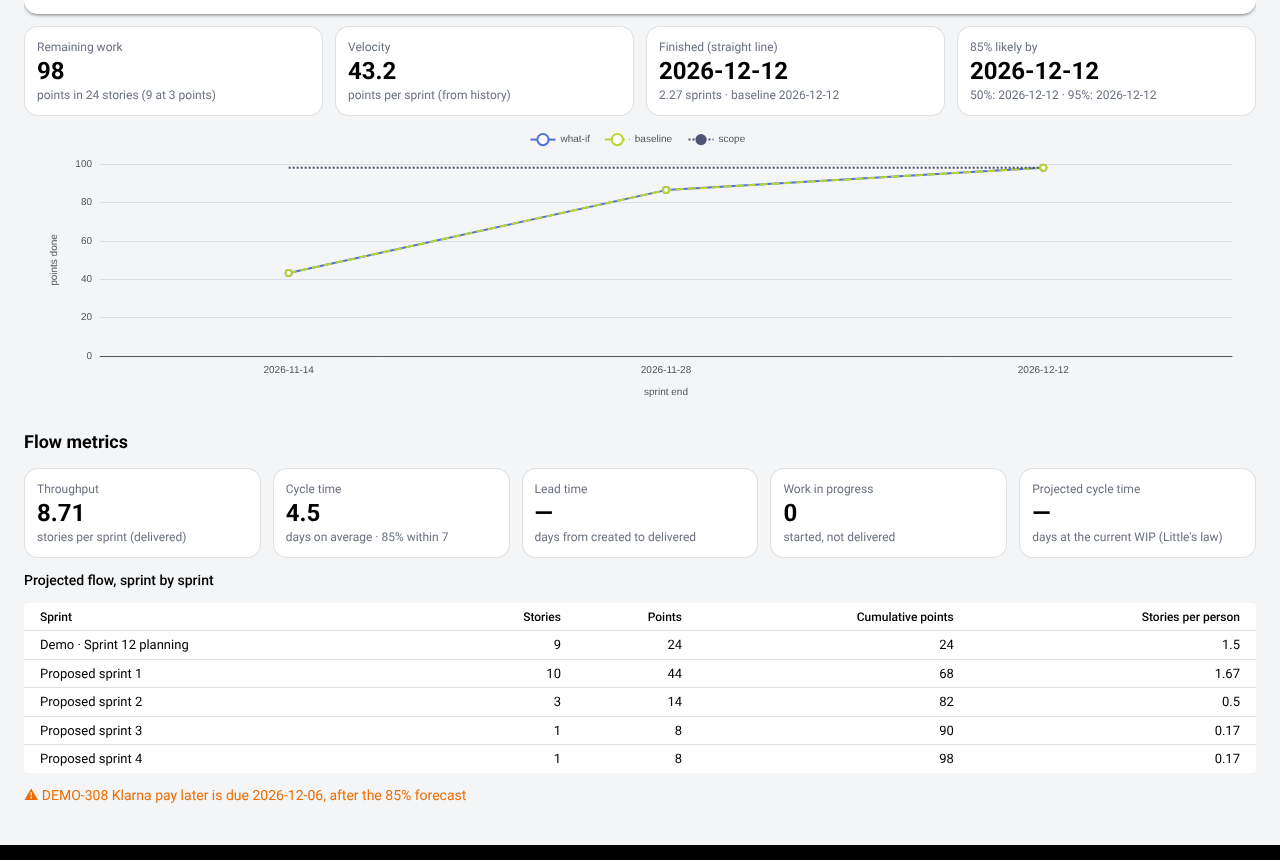
A Monte Carlo simulation over the team's real throughput gives 50, 70, 85 and 95% dates. In the planning workspace, change capacity, people, scope, velocity or the focus factor and see the delivery date move against the baseline, with projected flow per sprint and throughput, cycle time and work in progress.
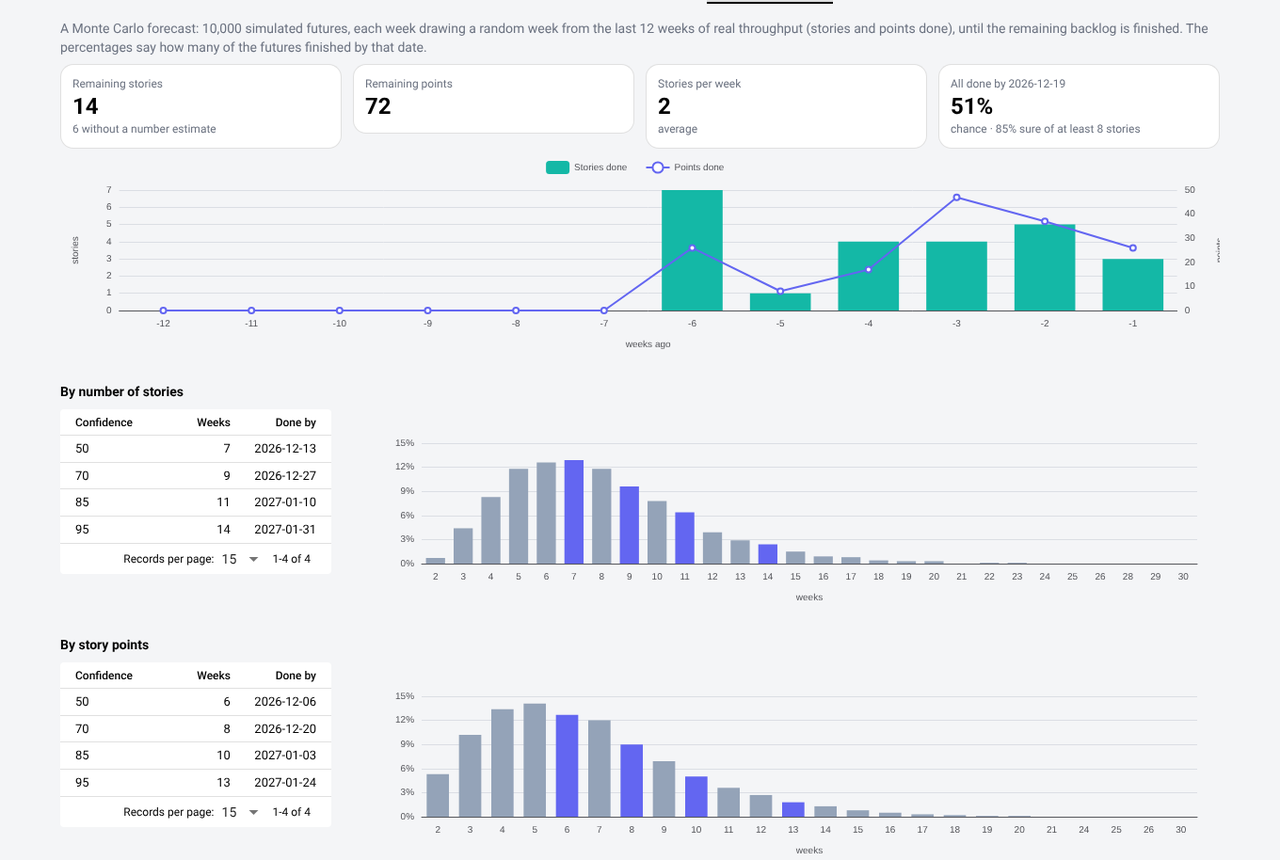
Monte Carlo forecast: weekly throughput, and the weeks needed with 50, 70, 85 and 95 percent confidence
Monte Carlo: 10,000 runs over weekly throughput.
What-if forecast: delivery dates, a burn-up against the baseline and flow metrics
What-if: the delivery date against the baseline, and a burn-up.
Estimate review

Learn why stories run over.

CHIPS flags every story that ran over its estimate: carried over, not done by the end of its sprint, or more working days or effort than its points. The scrum master gives each one a reason from the team's own list.

  • Twelve standard reasons to start from, in six categories, each marked as within the team's control or not. Add, edit and retire your own.
  • Bring in past sprints from Jira with a JQL query, or from a spreadsheet, so the review starts with real history.
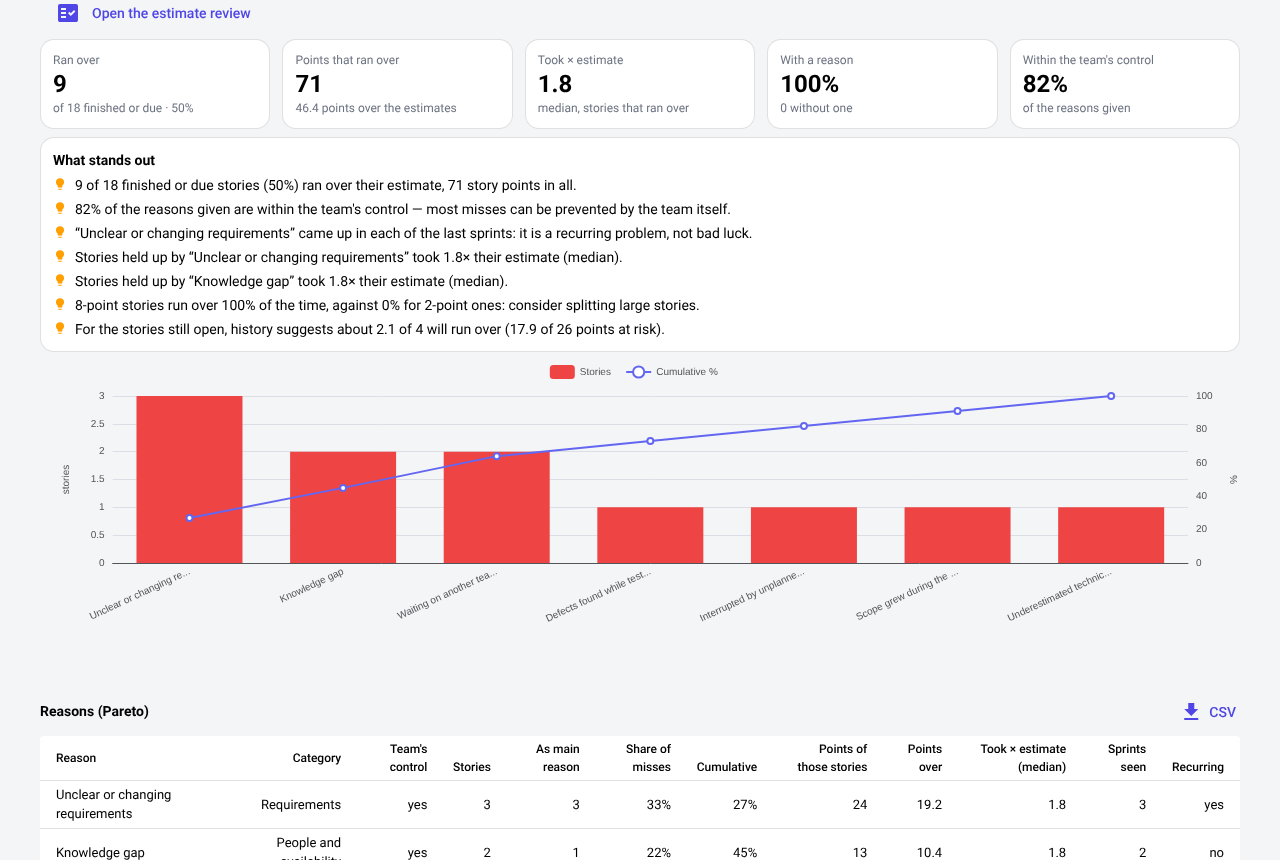
  • Reasons ranked in a Pareto chart, what each one costs, miss rate by story size, person and vote spread, and the risk for the sprint being planned.
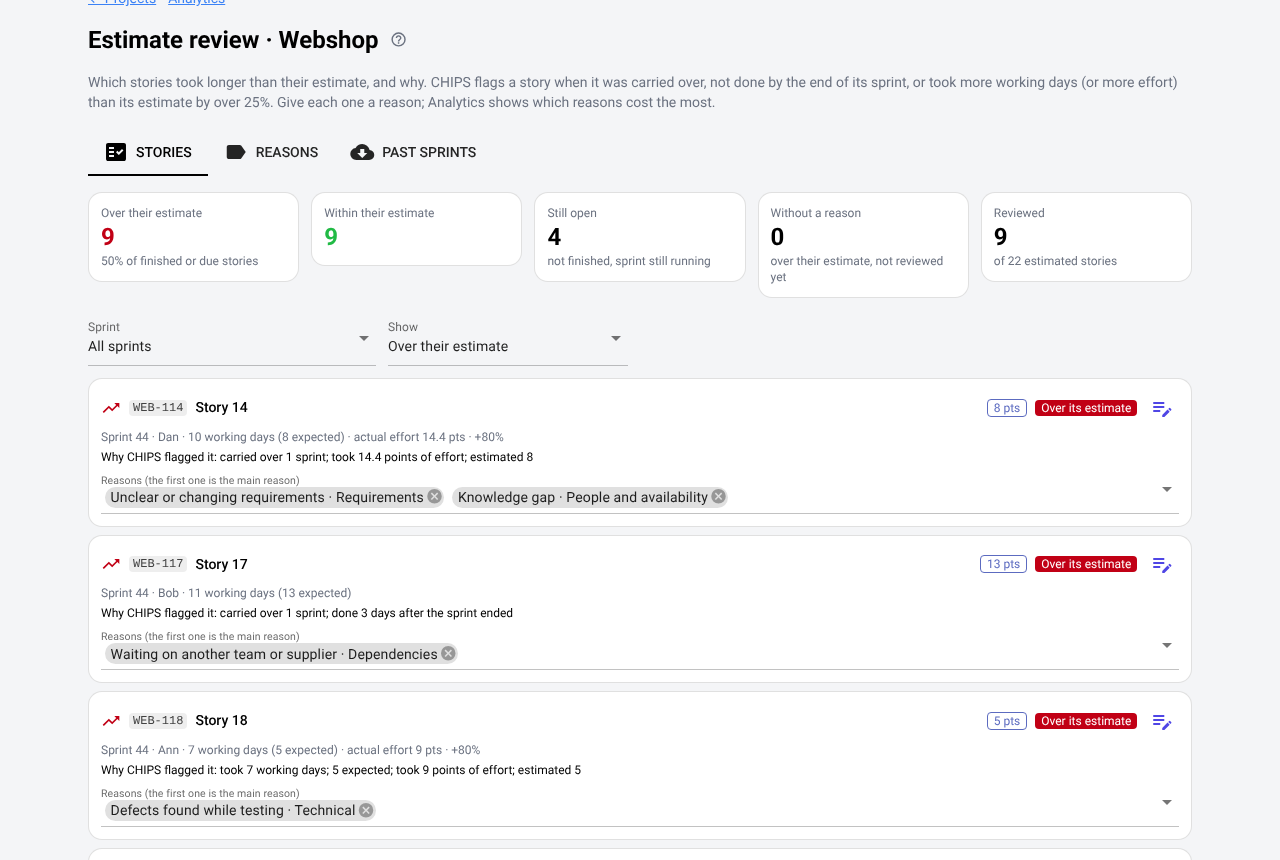
The estimate review: stories that ran over their estimate, each with why CHIPS flagged it and the reasons given
In the demo: stories of the earlier sprints that ran over, each with why CHIPS flagged it and the reasons the scrum master gave.
Missed-estimate analytics: findings in words and a Pareto chart of the reasons
The few reasons behind most misses: findings in plain words, such as “Unclear requirements came up in each of the last sprints”, and a Pareto chart.